User-Engagement-Analysis
WhatsApp Group Engagement Analysis — Scholar Hub

The Problem
Scholar Hub — a community of young European researchers — was watching its session attendance decline. Members weren’t showing up to the bi-weekly meetings the way they used to, and nobody could say exactly why or when the drop started.
The group ran entirely on WhatsApp: meeting reminders, follow-ups, session feedback, community discussion — all of it happened in one shared chat. That meant months of unstructured communication data sat inside a chat export file, untouched, while the people running the group guessed at what was going wrong.
The data to answer the question was already there. It just needed to be turned into something legible.
What I Built
An end-to-end engagement analytics solution — starting from a raw WhatsApp .txt chat export and finishing with an interactive Power BI dashboard that gave Scholar Hub management a clear, filterable picture of how their community was actually behaving.
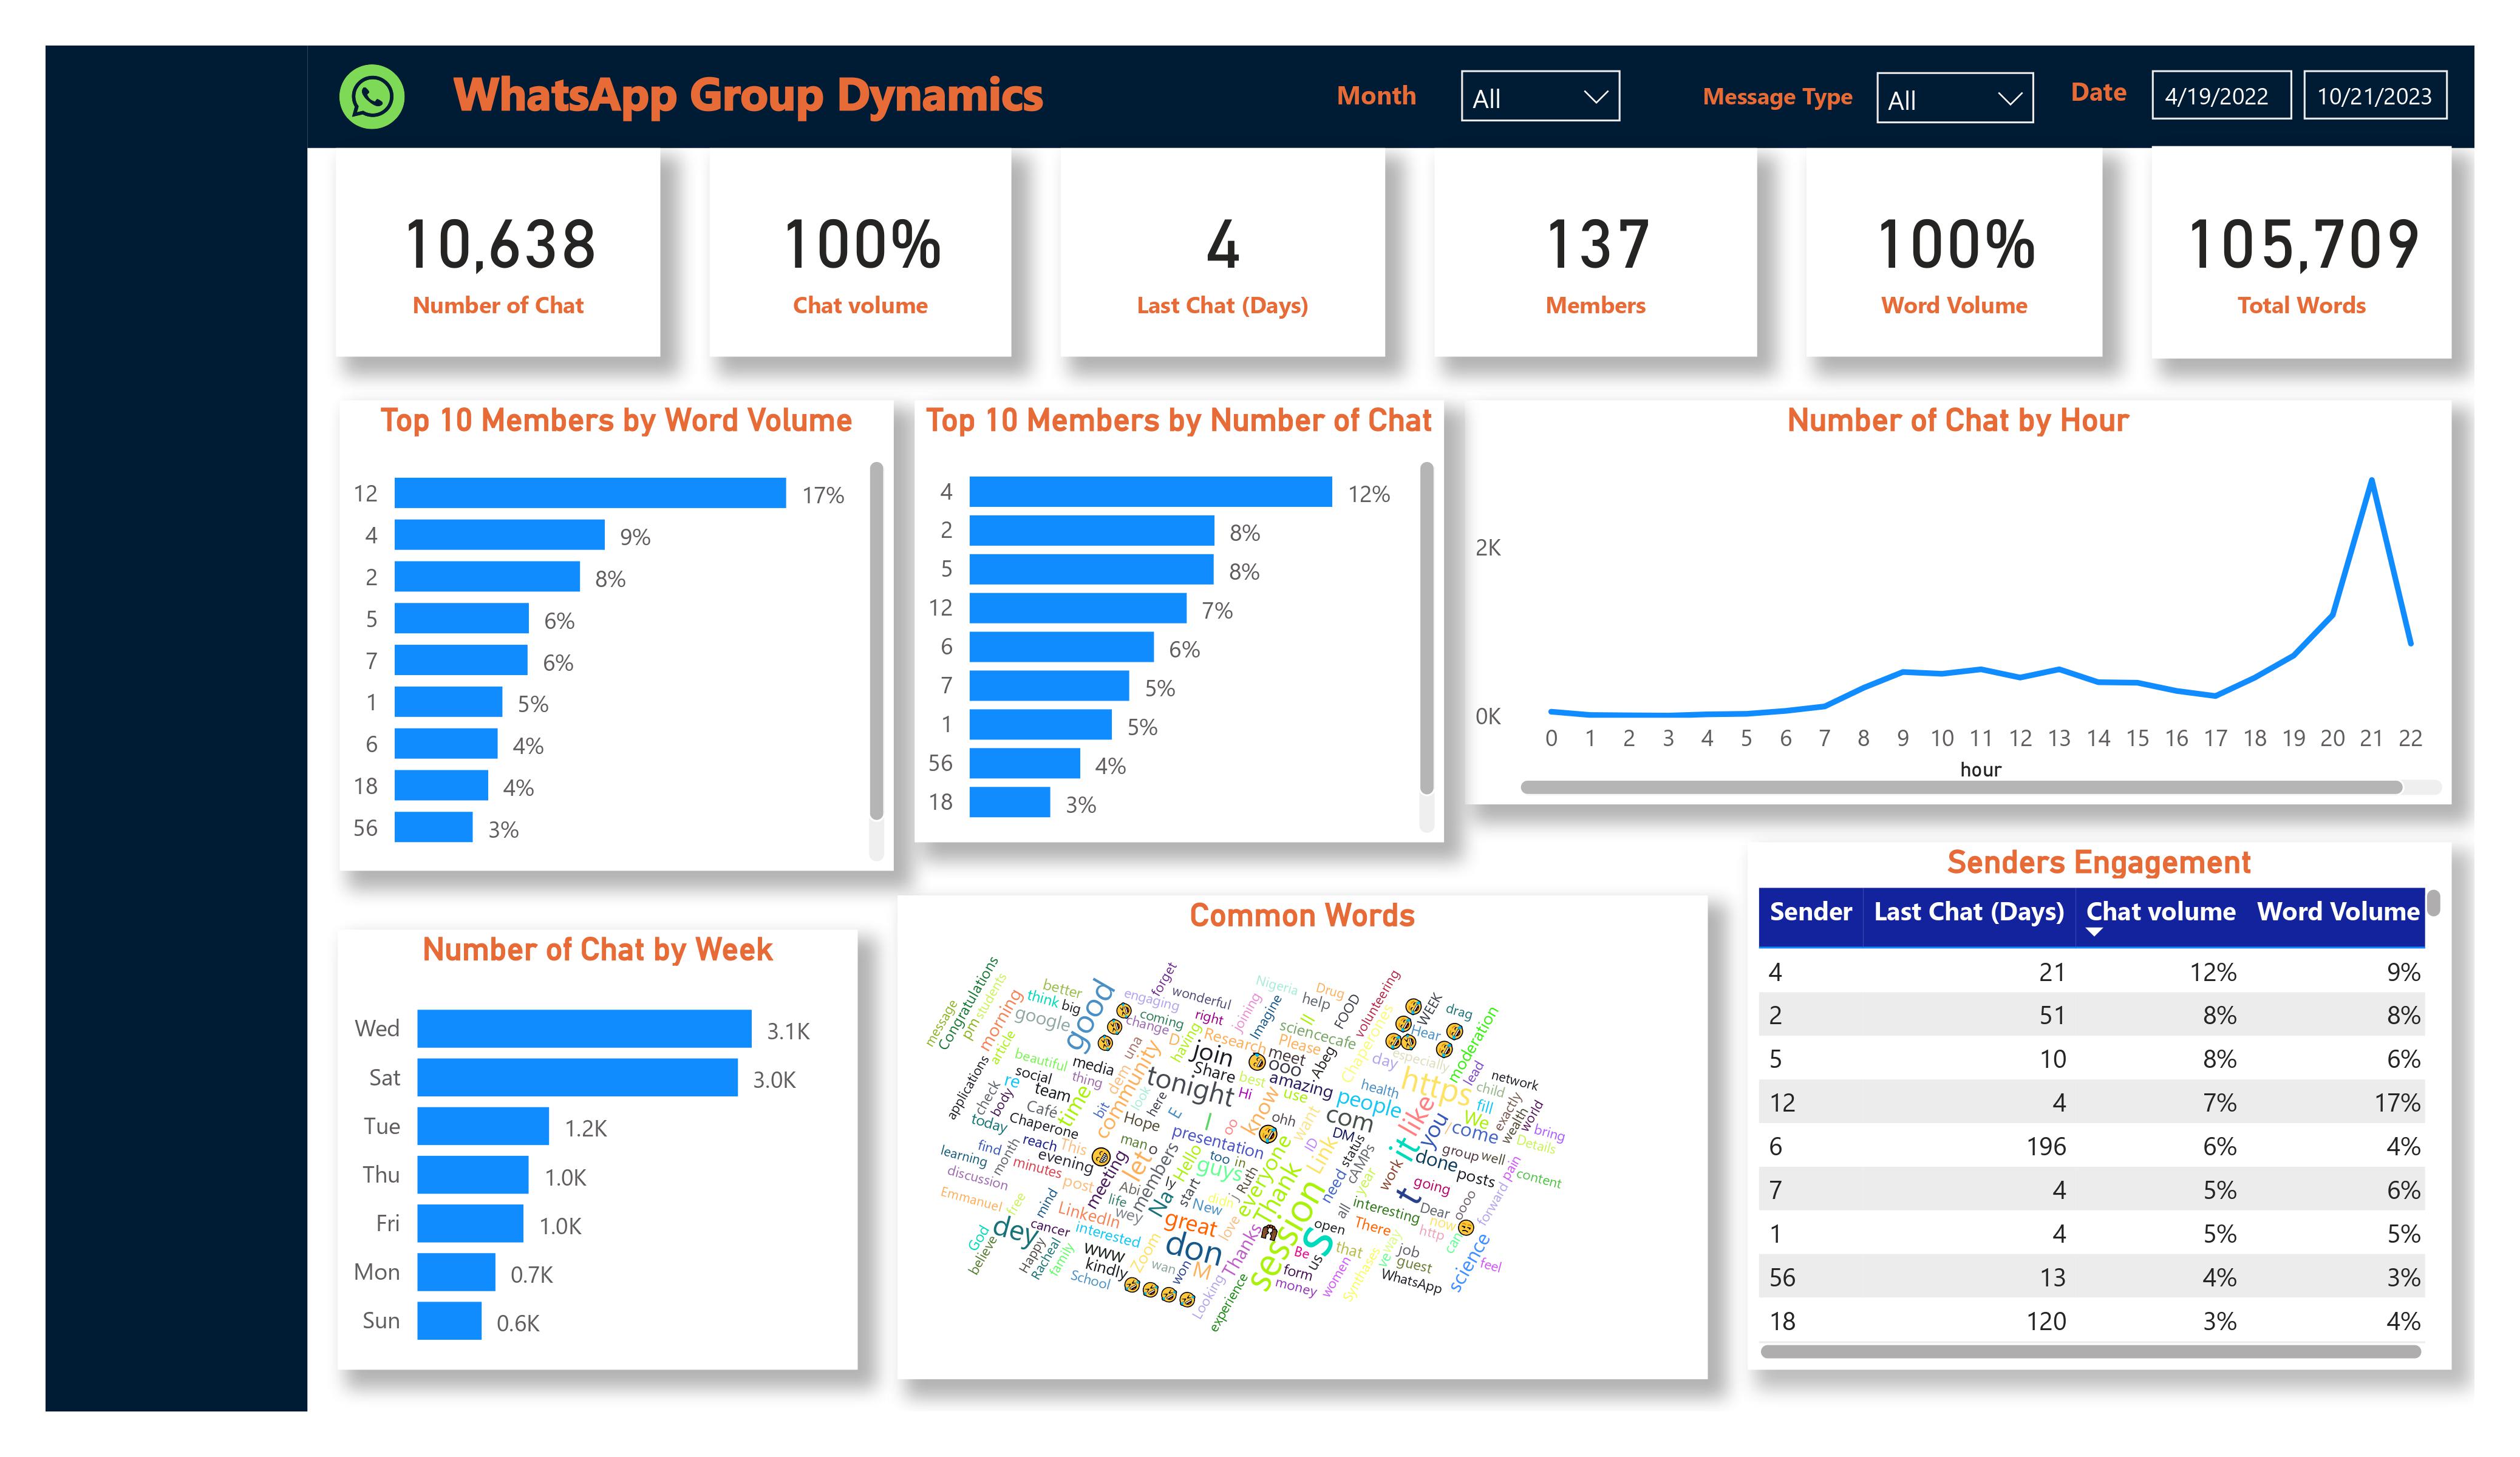
The dashboard surfaces participation trends, activity by member, time-of-day and time-of-week patterns, word frequency analysis, and — critically — early warning signals for members who are disengaging before they disappear entirely.
My Contribution
Python: Turning a Chat Export Into Usable Data
WhatsApp exports chat history as a plain .txt file — timestamps, sender IDs, and message content all run together in an unstructured format that no BI tool can read directly.
I wrote a Python script to parse and transform the raw export into a clean, structured CSV file: each row representing one message, with separate columns for timestamp, sender, message content, word count, and derived time fields (hour, day, week, month). This transformation step was the foundation everything else was built on — without it, no analysis was possible.
Power BI: Feature Engineering with DAX
Once the structured data was loaded into Power BI, I used DAX to create the calculated measures the analysis required:
- Chat volume — message count per sender, per time window
- Word volume — total words per sender and per period, which captures how much someone is saying, not just how often they post
- Most prevalent words — frequency analysis across the full message corpus to understand what topics dominate the conversation
- Activity recency — days since last message per sender, to flag members who had gone quiet
These weren’t decorative metrics. Each one was chosen because it answered a specific question about engagement quality, not just engagement quantity.
Dashboard Design
The final dashboard was built for non-technical decision-makers. Filters allow management to zoom in on individual members, specific time periods, or particular activity types — without needing to understand the underlying data model. The layout surfaces the most urgent signals (recent dropoffs, concentration of activity) immediately, with detail available on demand.
What the Data Revealed
The findings told a coherent story — one that explained the attendance decline and pointed to where intervention was most needed.
A small core is carrying the community
The top 10 members account for 62% of all messages and 65% of all words. The single most active member (Sender ID 12) alone contributes 7% of chat volume and 17% of word volume — meaning their messages are substantially longer than average, not just more frequent. They’re not just the most active; they’re doing the most work to keep the conversation alive.
That level of concentration is a fragility. A community where ten people generate nearly two-thirds of all activity is one departure away from going quiet.
The most active members have gone silent
The three highest-volume contributors — collectively responsible for 28% of total chat volume — had not posted in the two weeks before the analysis. The top contributor had last been active 22 days ago. The second-highest, 52 days ago.
This wasn’t gradual disengagement. These were the people the group depended on, and they had effectively already left.
Engagement has been falling since July
July represented the peak month of activity at 17% of total chat volume. February was the lowest at 3%. The decline between July and the analysis period was consistent and progressive — not a one-off dip. That pattern suggests a structural problem, not a seasonal one.
Activity concentrates around meeting time
46% of messages and 49% of words are exchanged between 8pm and 10pm, with a peak at 9pm — directly overlapping the scheduled meeting window. The most common words in the corpus — session, tonight, join, great, everyone — confirm that the chat functions almost entirely as a meeting coordination channel rather than an ongoing community space.
When meetings end, conversation ends. There’s very little activity that isn’t meeting-adjacent, which means the community has no engagement floor — no baseline activity to sustain momentum between sessions.
Recommendations
Each recommendation flows directly from a finding in the data.
1. Re-engage the lapsed top contributors immediately
The three highest-volume members going quiet is the single most urgent signal. A direct, personal outreach — not a group broadcast — acknowledging their contributions and asking specifically what changed would be more effective than a general engagement push. Their silence may reflect something fixable: timing, content, or feeling unappreciated.
2. Reduce dependence on a 10-person core
Design structured opportunities for lower-active members to contribute — topic-specific threads, rotating discussion leads, or peer question formats where members are directly invited to respond. The goal is to widen the base of participation so the community isn’t vulnerable to the departure of any single individual.
3. Build engagement between meetings
The current pattern — activity spikes at 9pm on meeting days, quiet the rest of the time — means there’s no community between sessions. Introducing lightweight, low-commitment engagement formats between meetings (a weekly question, a member spotlight, a shared reading) would create an activity floor that makes the group feel alive even when no meeting is scheduled.
4. Investigate the July inflection point
Something changed in July that started a consistent decline. That month’s events, leadership changes, or community dynamics are worth reviewing explicitly — understanding what peaked then and why it reversed would give management a much clearer diagnostic than the trend data alone.
5. Acknowledge top contributors publicly
Sender ID 12 is doing disproportionate work to keep the group active. Recognition — even informal, within the group — signals to high contributors that their effort is seen. It also models the behaviour the community wants to encourage in others.
Tech Stack
| Area | Tools |
|---|---|
| Data Extraction & Transformation | Python (custom parsing script) |
| Data Processing | Pandas |
| Analytics & Dashboard | Power BI |
| Custom Calculations | DAX |
| Project Management | Trello |
What I’d Do Differently
- Sentiment analysis on message content — word frequency tells you what people are talking about, but not how they feel about it. Running a sentiment model over the message corpus would reveal whether the tone of the group shifted before the engagement decline, which would be a far richer diagnostic.
- Network analysis — mapping who replies to whom would reveal the actual social structure of the group: whether there are sub-communities, whether certain members act as connectors, and whether the network has become more disconnected over time. A community where everyone talks to the same two people is structurally fragile in a way that participation counts alone won’t show.
- Automated alerts — the most actionable output of this analysis would be an automated notification when a high-value member’s activity drops below a defined threshold, triggered in real time rather than discovered retrospectively. Building that into the data pipeline would turn the dashboard from a retrospective tool into a proactive one.
- Anonymised member profiles — rather than tracking individual sender IDs, a more privacy-respecting approach would be to build engagement archetypes (high-frequency/low-depth, low-frequency/high-depth, consistent/irregular) and target interventions at each type — without needing to identify specific individuals.
Let’s Talk
If you’re working on a community analytics, NLP, or business intelligence problem and need someone who can go from raw unstructured data to actionable insight — get in touch.