Renewable-Energy-Forecast
Renewable Energy Load Shortfall Forecast — Spain
The Problem
Spain is in the middle of a serious energy transition. The government is committed to expanding renewable energy capacity — but committing to that transition without knowing how large the gap between renewable supply and actual demand will be at any given time is a planning problem with real consequences.
If the shortfall is underestimated, the grid falls short during peak hours and fossil fuel plants have to compensate at the last minute — expensive, carbon-intensive, and exactly what the transition is meant to avoid. If it’s overestimated, the government over-invests in infrastructure that sits idle.
The question the government needed answered wasn’t whether there would be a shortfall. It was: how large will it be, and when?
What I Built
A regression model that forecasts the load shortfall — the gap between electricity demand and what Spain’s renewable sources (wind, solar, hydro, and others) can supply — across different time windows.
The model was trained on historical energy production and demand data, capturing the time-of-day, day-of-week, and seasonal patterns that drive shortfall fluctuations. It was deployed as a live API on AWS using Flask, so forecast outputs could be consumed directly by planning systems.
The model also competed in a Kaggle competition, where it ranked first — evaluated against other teams on held-out test data using RMSE.
My Role: Technical Lead
I led the technical direction of the project end-to-end — from setting up the data pipeline through model selection, evaluation, and deployment. Specifically:
Data Quality & Exploration
Before any modelling, I conducted a systematic audit of the dataset — identifying structural issues, missing values, and anomalies that would have distorted model training if left uncorrected. Good data isn’t something you assume; it’s something you verify. This stage shaped every decision that followed.
Insight Discovery
The EDA surface three meaningful patterns in the shortfall data that directly informed the recommendations to government:
Daily pattern — peak shortfall during office hours
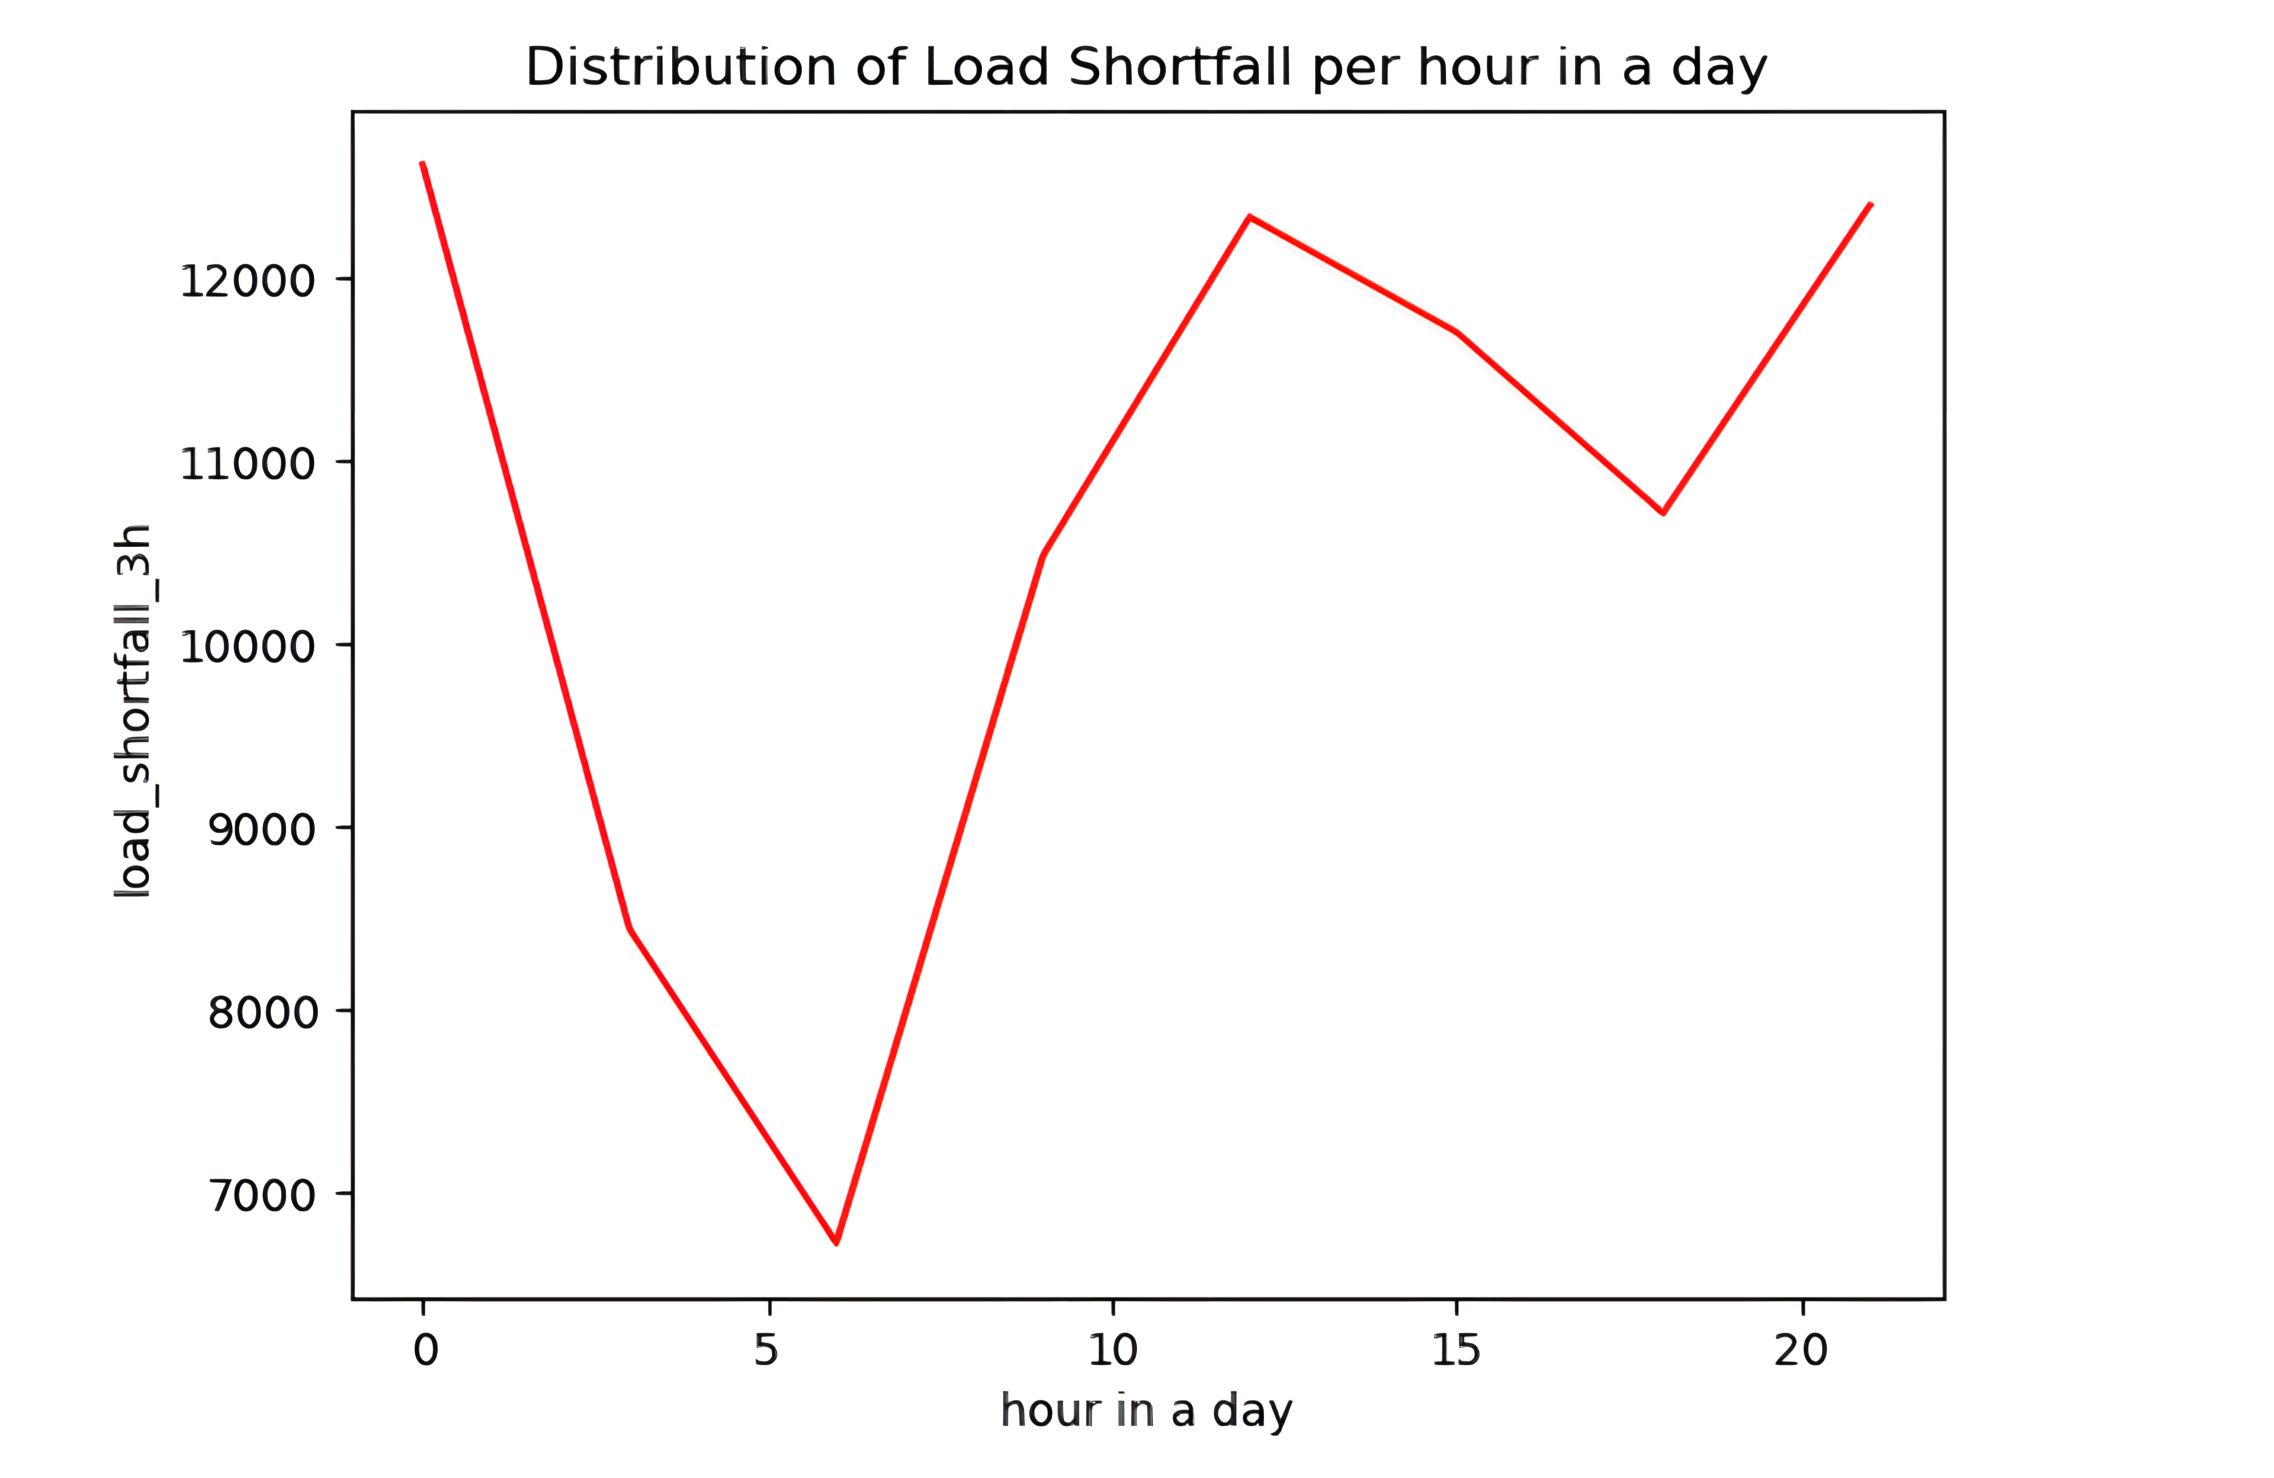
Shortfall peaks between 9am and 12pm — the overlap of office electricity consumption and domestic appliance use. This is the window where grid stress is highest and where targeted storage or demand-side management would have the most impact.
Weekly pattern — weekdays vs. weekends
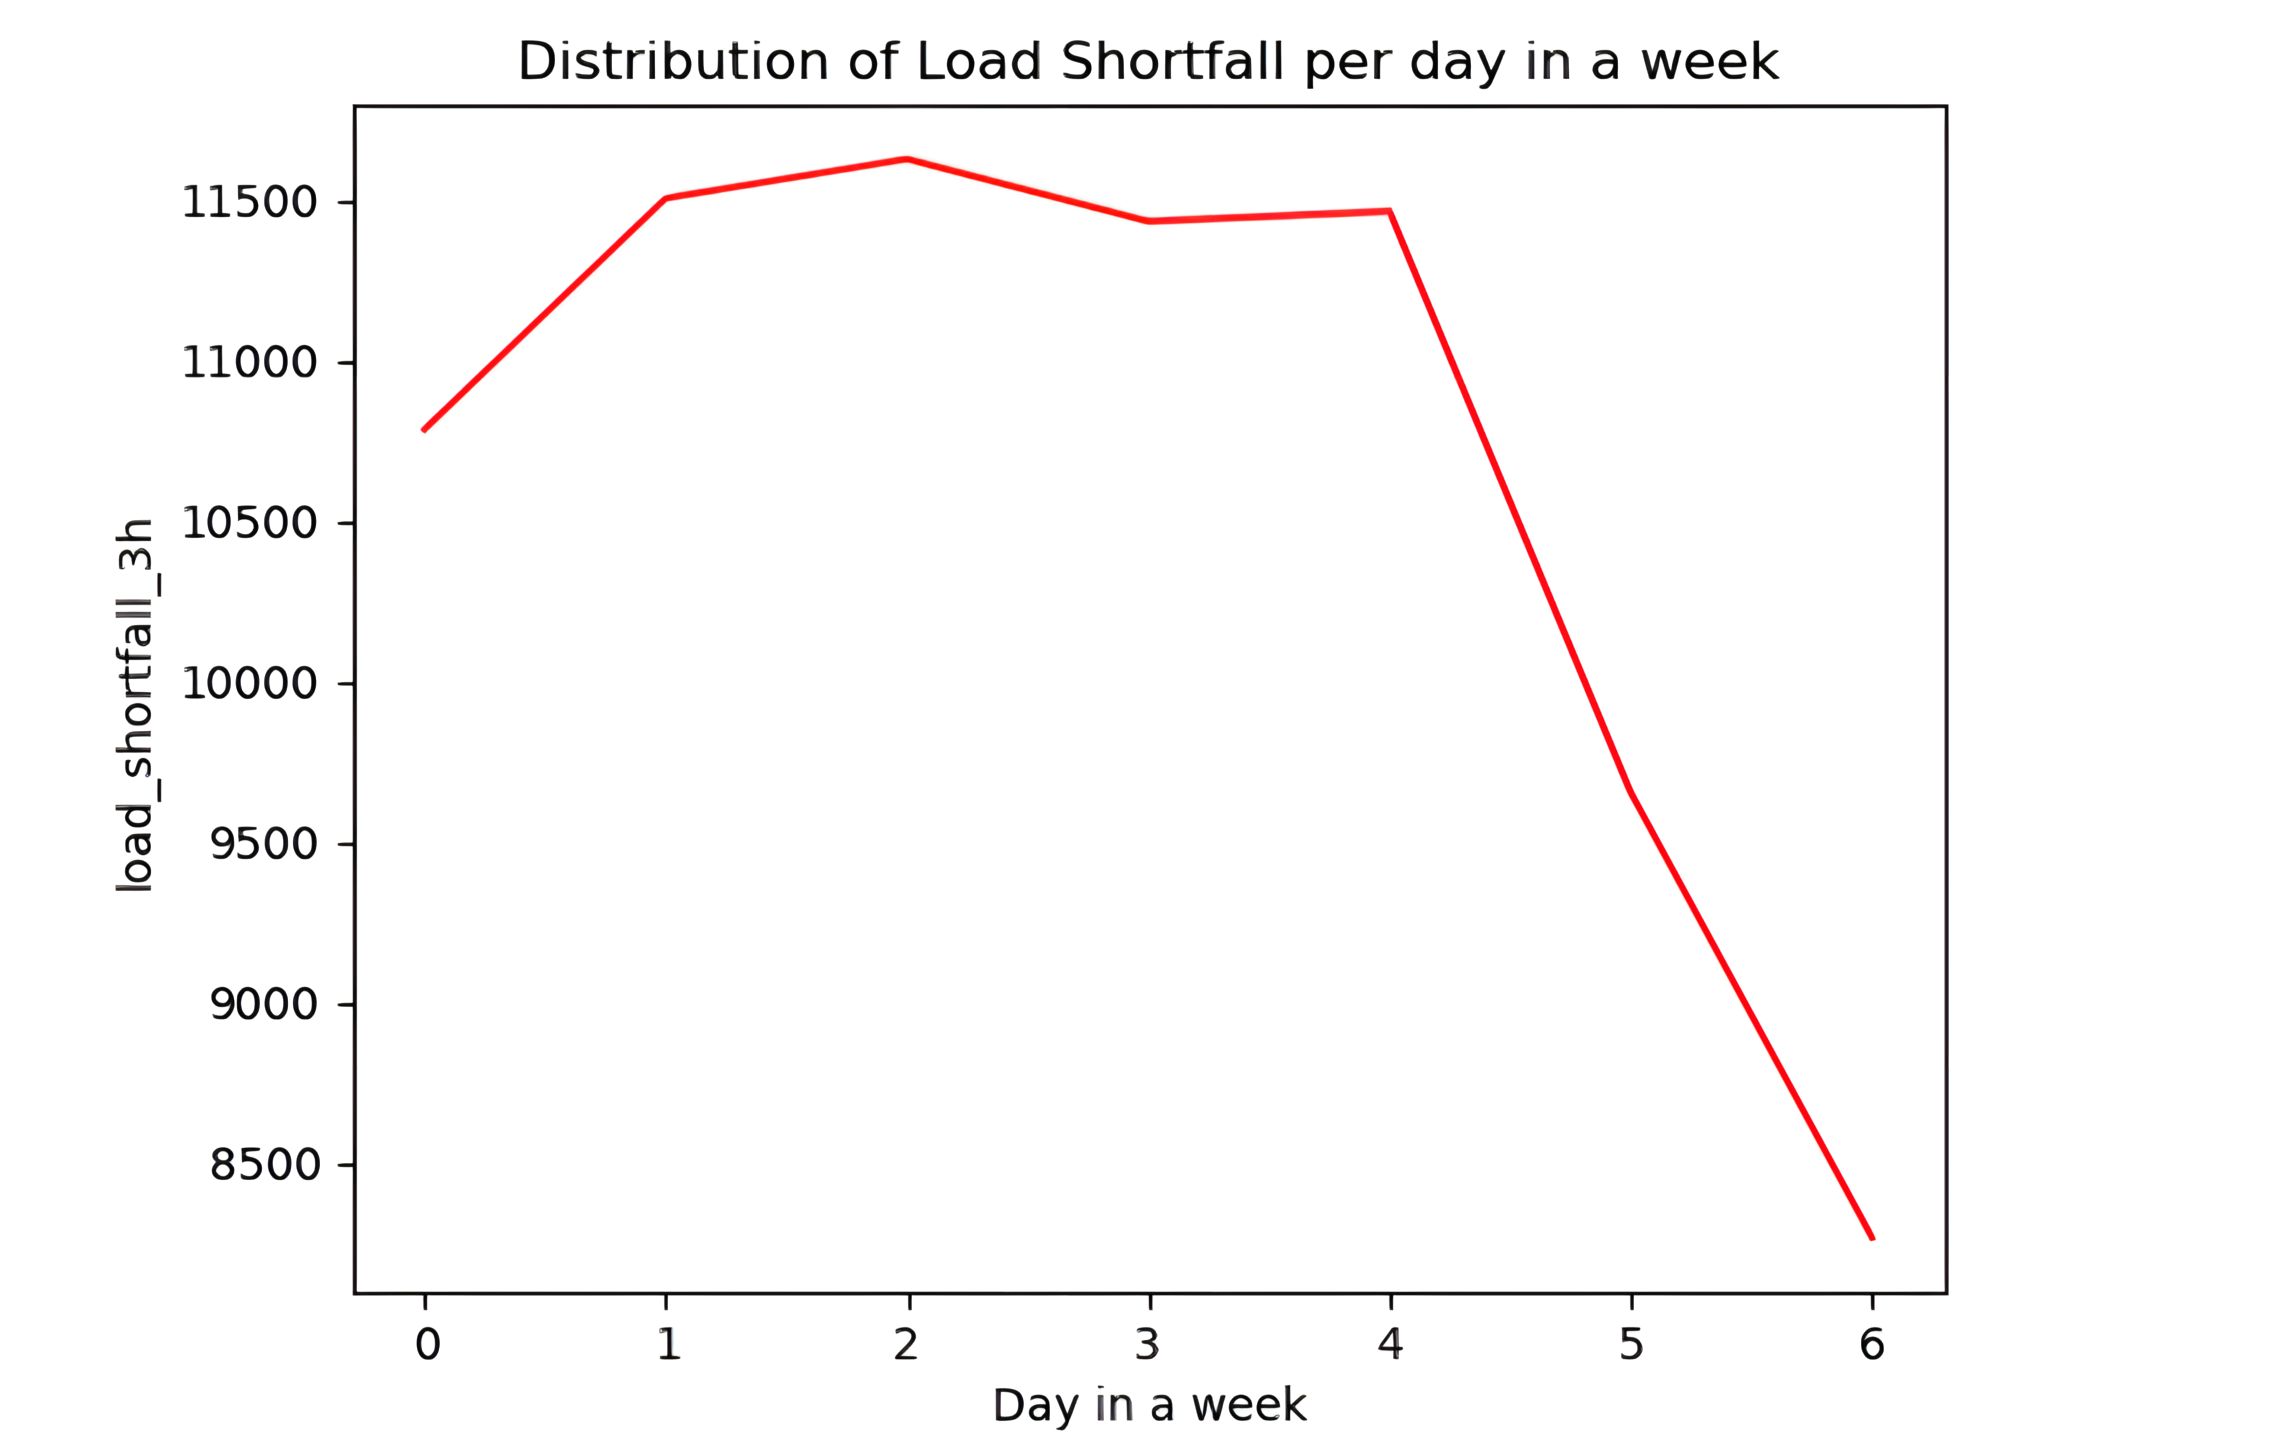
Weekdays consistently show a higher shortfall than weekends, reflecting the electricity demands of working hours. The implication: policies aimed at load-shifting (incentivising off-peak usage) should focus on the working week.
Seasonal pattern — summer and winter peaks
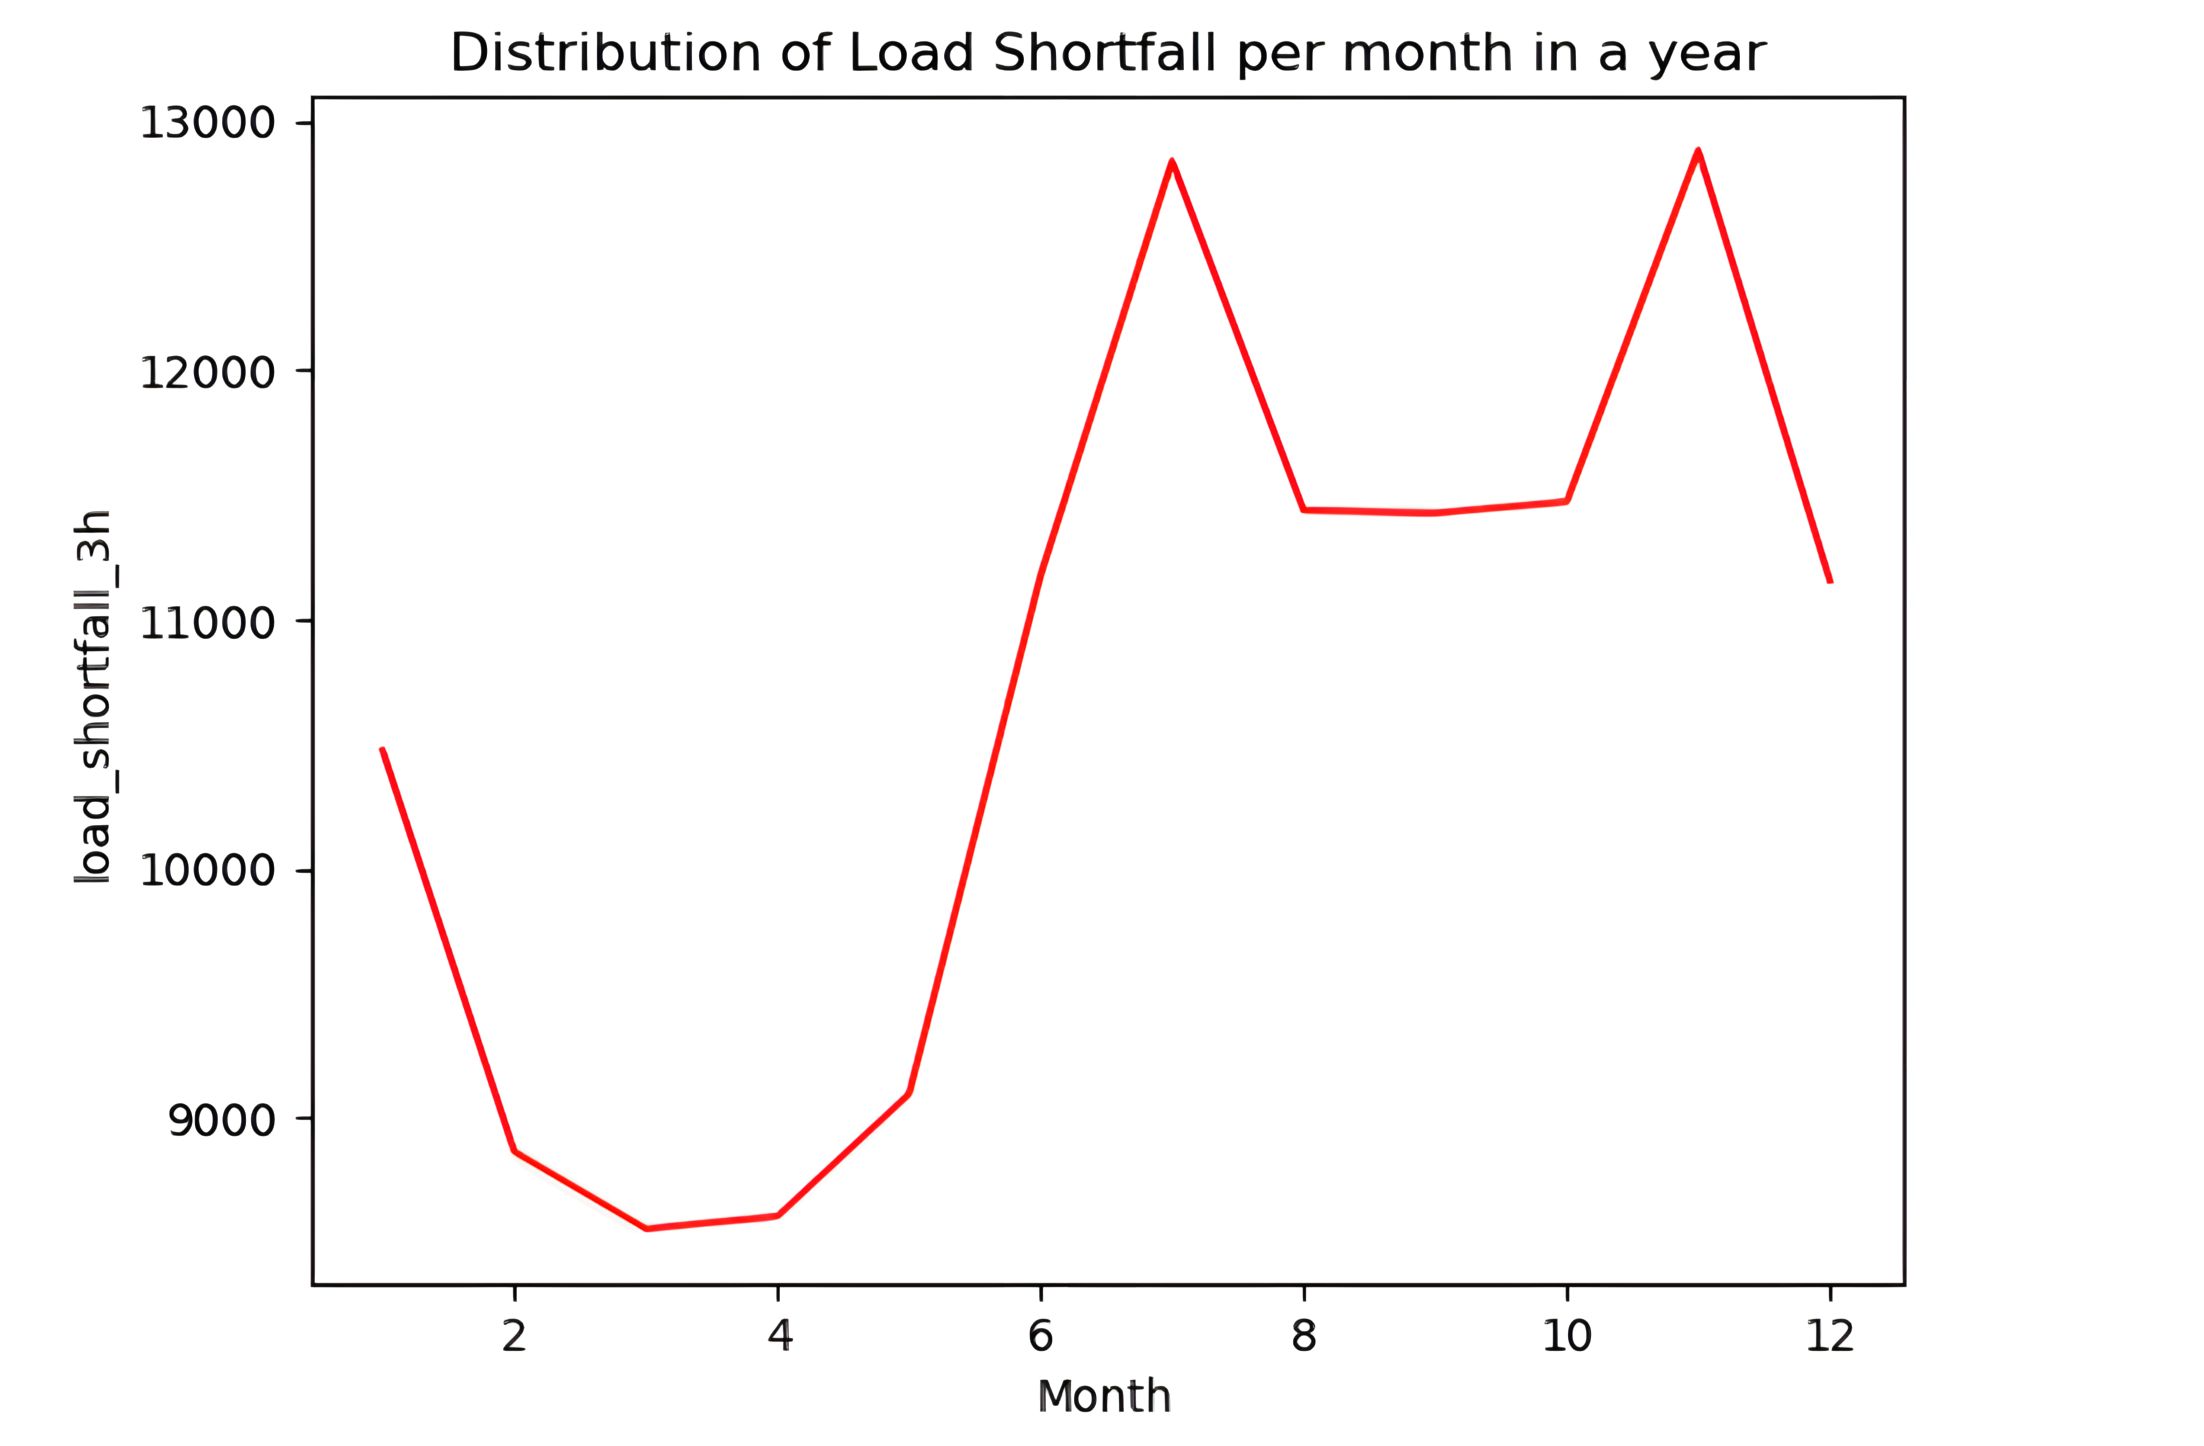
The second half of the year sees significantly elevated shortfall — driven by air conditioning in summer and heating demand in winter. Seasonal grid planning and renewable capacity scheduling need to account for this asymmetry.
Model Training & Selection
I designed the modelling experiments and led the comparison across five regression algorithms:
| Model | Notes |
|---|---|
| Linear Regression | Strong interpretable baseline |
| Decision Tree | Captures non-linear patterns; prone to overfitting without tuning |
| Random Forest | Robust ensemble; good generalisation |
| Support Vector Machine | Effective in high-dimensional space |
| Light GBM (LGBM) | Best RMSE — selected for deployment |
LGBM outperformed all others on RMSE, which measures how far off predictions are from actual shortfall values in real units — the metric that matters when you’re making infrastructure decisions. LGBM’s gradient boosting approach handles the non-linear, temporal structure of energy data better than simpler models, and it trains efficiently even on large datasets.
Deployment
The winning model was deployed as a REST API using Flask on an AWS EC2 instance — making the forecast accessible to other systems programmatically, not just through a static notebook.
Tech Stack
| Area | Tools |
|---|---|
| Language | Python |
| Data Processing | Pandas, NumPy |
| Modelling | Scikit-learn, LightGBM |
| Evaluation | RMSE (Root Mean Square Error) |
| Deployment | Flask, AWS EC2 |
| Project Management | Trello |
| Version Control | GitHub |
Recommendations to Government
The patterns in the data pointed to four concrete policy directions:
-
Invest in energy storage for morning peaks. The 9–12am shortfall window is consistent and predictable — making it exactly the kind of problem battery storage infrastructure is designed to solve. Storage charged overnight from renewable sources could cover this gap without touching fossil fuels.
-
Boost weekday renewable generation. Policies that incentivise solar and wind operators to maximise output during working days — or shift industrial consumption to lower-demand windows — would reduce the weekday/weekend shortfall disparity.
-
Plan seasonal capacity in advance. Summer and winter shortfalls are foreseeable. Grid operators should schedule capacity increases and maintenance windows around spring and autumn, when shortfall is lowest.
-
Promote energy-efficient cooling and heating. A significant portion of the seasonal shortfall is driven by temperature-related appliance use. Efficiency standards and consumer incentives for heat pumps and efficient HVAC systems reduce peak demand at the source.
What I’d Do Differently
- Incorporate weather forecasts as features. Renewable output — especially solar and wind — is weather-dependent. Adding forecast temperature, cloud cover, and wind speed data as model inputs would substantially improve prediction accuracy, particularly for day-ahead planning.
- Time series modelling. The current approach treats each observation somewhat independently. A proper time series model (LSTM or Prophet) would better capture autocorrelation — the fact that today’s shortfall is influenced by yesterday’s.
- Uncertainty quantification. A point forecast (one number) is useful, but a government making infrastructure decisions needs to know the range of plausible outcomes, not just the expected value. Prediction intervals or probabilistic forecasts would make the model more honest and more actionable.
- Granular regional modelling. Spain’s energy mix and demand patterns vary significantly by region. A single national model averages over this variation; regional models would give planners more precise targets.
Team
This project was a team effort. Credit to the full group:
- Jacinta Muindi
- Abiodun Adeagbo
- Seye Tare Ganranwei
- Pere Ganranwei
- Job Onose Okhueleigbe
Let’s Talk
If you’re working on a forecasting, regression, or data science problem — particularly in energy, infrastructure, or policy — get in touch.