Auralin-clinical-trial
Auralin Phase II Clinical Trial — Statistical Analysis
Disclaimer: The clinical dataset used in this project is fabricated for data wrangling practice, constructed with input from real doctors to simulate a realistic trial environment. Auralin and Novodra are fictional insulin products modelled on a real inhaled insulin, Afrezza. No real patient data was used.
Background
More than 400 million people worldwide live with diabetes. For most of them, managing the condition means injecting insulin multiple times a day — a routine that is painful, inconvenient, and, for many patients, a barrier to consistent treatment adherence.
An oral insulin tablet would change that completely. It’s easier to take, less intimidating, and far more compatible with daily life. But promising easier administration is not enough. Any new treatment has to prove it can actually do the job — that it controls blood glucose as effectively as the standard injectable insulin patients already rely on.
This project analyses a Phase II clinical trial comparing Auralin (an oral insulin) against Novodra (a standard injectable insulin) as the control. The question the trial is designed to answer: is Auralin’s glycaemic control comparable enough to Novodra’s to justify advancing to Phase III?
Hypothesis
H₀ (Null): There is no significant difference in HbA1c reduction between patients treated with Auralin and those treated with Novodra.
H₁ (Alternative): Auralin produces a comparable or superior HbA1c reduction to Novodra.
HbA1c — glycated haemoglobin — is the standard clinical measure of long-term blood glucose control. A meaningful reduction in HbA1c over the trial period indicates effective glycaemic management.
The Data Challenges
Clinical trial data is rarely clean, and this dataset was no exception. Before any statistical analysis could be trusted, the data needed to be carefully audited and restructured. Two issues stood out as particularly consequential.
Duplicated patient records
A patient audit revealed that a single individual — John Doe — had been recorded under six different patient IDs, creating phantom entries that would have inflated sample sizes and skewed group-level statistics.
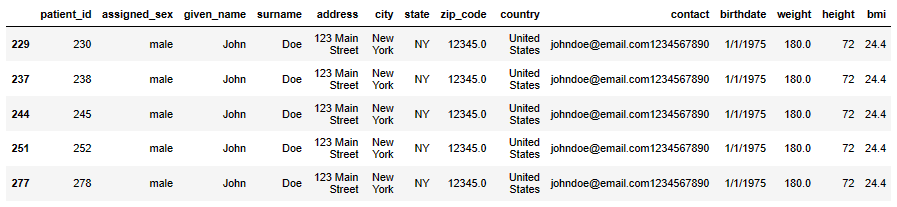
Finding this required more than a simple duplicate-row check. The records were distinct in ID but identical in clinical profile — the kind of issue that only surfaces through careful cross-referencing of multiple fields simultaneously.
Structural misrepresentation of treatment data
The dataset encoded treatment information — treatment type, starting dose, and ending dose — as two columns named auralin and novodra, rather than three separate, properly typed fields.
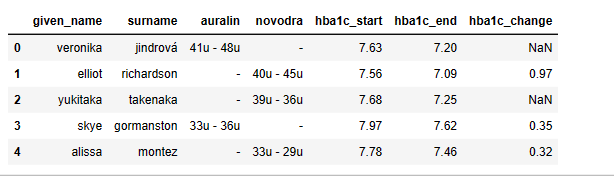
This structural flaw made it impossible to run treatment comparisons correctly without first reshaping the data. I separated it into three distinct features (treatment, start_dose, end_dose) and validated the transformation against the raw data before proceeding.
The cleaned dataset
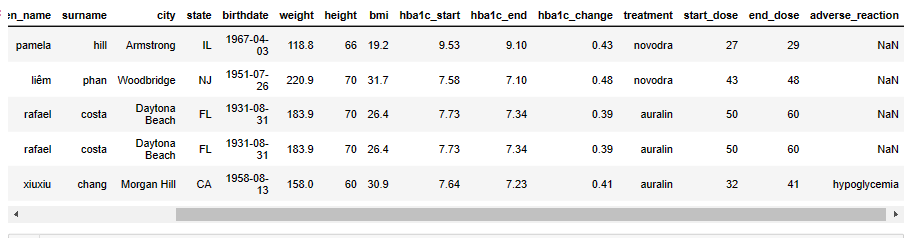
In addition to the two major issues above, I addressed missing values, incorrect data types, and formatting inconsistencies across the full dataset before any analytical work began.
Analysis & Findings
With a reliable dataset in place, I ran three lines of inquiry — each corresponding to a question the trial sponsor would need answered before making any advancement decision.
1. Does Auralin achieve comparable glycaemic control to Novodra?
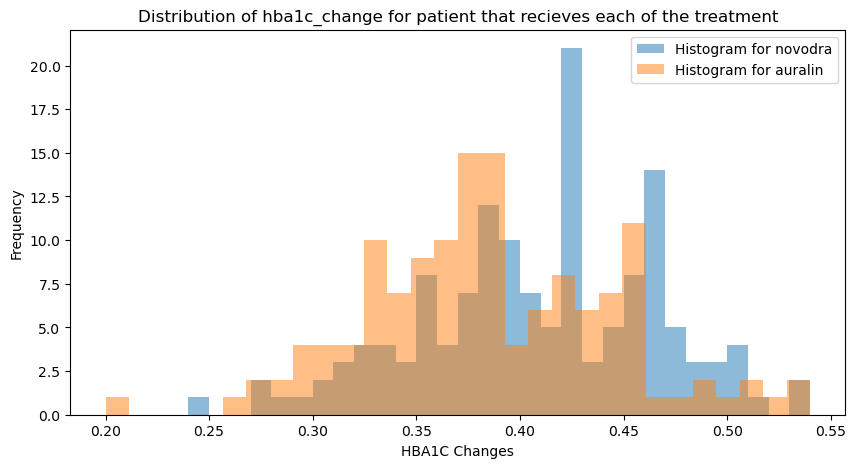
A two-sample t-test on HbA1c changes across treatment groups produced the following result:
| Statistic | Value |
|---|---|
| t-statistic | 3.08 |
| p-value | 0.002 |
| Significance level (α) | 0.05 |
| Decision | Reject H₀ |
The result is statistically significant. Novodra produced a meaningfully greater reduction in HbA1c than Auralin over the trial period. Auralin did not achieve comparable glycaemic control under the conditions tested.
This is the most important finding in the entire analysis — the oral delivery mechanism, while more patient-friendly, did not match the injectable standard on the primary clinical endpoint.
2. How do the side effect profiles compare?
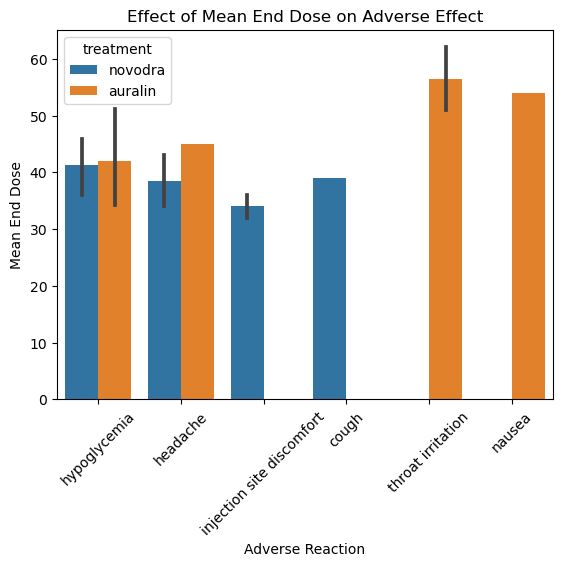
Each treatment produced a distinct adverse effect profile:
Auralin — throat irritation and nausea were the most common adverse events, consistent with oral/inhalation delivery. Headache and hypoglycaemia were also reported more frequently in the Auralin group than in Novodra patients.
Novodra — injection site discomfort was the dominant adverse event, as expected for a subcutaneous injection. Systemic side effects were less pronounced than in the Auralin group.
The side effect comparison matters for two reasons. First, it provides context for the efficacy finding — Auralin’s lower HbA1c reduction is not explained by a higher incidence of adverse events that forced dose reductions. Second, it gives the sponsor a clear picture of what a Phase III trial would need to monitor.
3. Does increasing the dose improve outcomes?
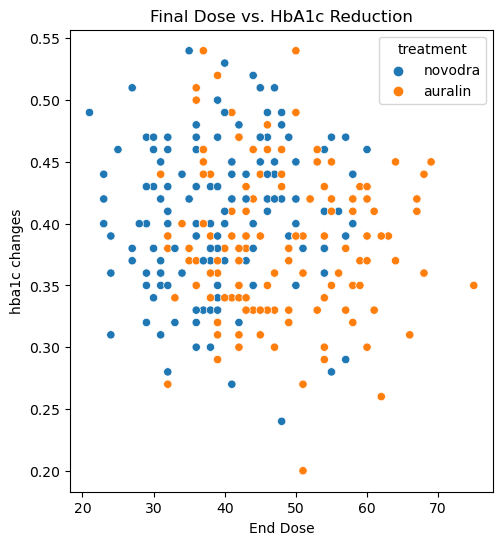
The dose-response relationship differed sharply between the two treatments:
| Treatment | Correlation Coefficient | Direction |
|---|---|---|
| Auralin | −0.073 | Inverse — higher dose, less HbA1c reduction |
| Novodra | +0.090 | Direct — higher dose, more HbA1c reduction |
For Novodra, the relationship is intuitive: more insulin, better control. For Auralin, the opposite holds — and this is a clinically significant finding. It suggests that higher doses of Auralin may not be the right lever to pull when efficacy is insufficient. In fact, the data implies that using the minimum effective dose may be the better strategy, as it would limit side effect exposure without a corresponding loss in glycaemic benefit.
Summary of Conclusions
| Question | Finding |
|---|---|
| Does Auralin match Novodra on glycaemic control? | No — Novodra shows significantly greater HbA1c reduction (p = 0.002) |
| Are Auralin’s side effects acceptable? | Manageable, but headache and hypoglycaemia are more frequent than with Novodra |
| Does higher Auralin dosing improve outcomes? | No — the relationship is inverse; minimum effective dose is recommended |
The overall picture for Auralin as tested here is mixed. The convenience case for oral insulin remains compelling — but the Phase II data does not yet support non-inferiority to injectable insulin. Before advancing to Phase III, the sponsor would need to either optimise the formulation for better absorption or refine the dosing protocol based on the inverse dose-response finding.
Tech Stack
| Area | Tools |
|---|---|
| Language | Python |
| Data Processing | Pandas, NumPy |
| Statistical Testing | SciPy (t-test), Correlation Analysis |
| Visualisation | Matplotlib, Seaborn |
| Reporting | Jupyter Notebook |
What I’d Do Differently
- Intention-to-treat analysis — a rigorous clinical trial analysis should include all randomised patients in the primary endpoint analysis, regardless of protocol deviations. Separating the per-protocol and ITT populations and comparing results would strengthen the validity of the conclusions.
- Confidence intervals alongside p-values — statistical significance alone tells you whether an effect exists; confidence intervals tell you how large it might plausibly be. Reporting both gives a more complete and honest picture of uncertainty.
- Subgroup analysis — the trial-level results may mask important variation. Stratifying by age, diabetes type, baseline HbA1c, or BMI could reveal whether Auralin performs better in specific patient populations — which is often how a drug finds its clinical niche even when it doesn’t win in the overall population.
- Survival analysis for adverse events — rather than counting adverse event occurrences, a time-to-event analysis would show when during the trial side effects tended to emerge, which matters for dose titration guidance.
Let’s Talk
If you’re working on a statistical modelling, clinical data, or analytical problem that needs rigorous handling — get in touch.